Tuesday, November 22, 2011

Discipline and Punishment

I’ve been reading Steven Pinker’s The Better Angels of Our Nature documenting the worldwide decline in all forms of predatory or disciplinary violence and I thought it would be a good time to look at the Smart Vote on a few forms of disciplinary harshness. In particular I will be looking at support for capital punishment for murder, courts passing harsher sentences and the use of spanking to discipline children. All of these issues have vociferous advocates on both sides and make for highly emotional exchanges. Nevertheless a large majority of opinion supports all of them in the USA - although, in line with Pinker’s book, support has been dropping. Support for capital punishment for murder has declined from 82% to 73%; for harsher sentences from 92% to 71%, and for spanking of children from 83% to 68%. The proportion of the population who support all three has dropped from 65% to 47% and the proportion opposing all three has risen from 7% to 20% - still less than half of those supporting all three.

Let’s start with capital punishment for the crime of murder. Arguments for capital punishment are that it is a fitting price to pay for the crime and that the harshness of the penalty makes it an effective deterrent. One econometric study reached the conclusion that each execution saves the lives of 8 potential murder victims. That is quite efficient, even if there is a high error rate in convictions, but the validity of the conclusion depends a lot on the validity of some of the model’s assumptions. Quite a lot of the deterrent value depends on the perceived probability of being caught and punished and the extent to which this probability is perceived to be constant across all groups i.e. not capricious.

Arguments against capital punishment are that it is barbaric, irreversible if in error, that it brutalizes the population and probably serves as an example that makes violence more acceptable and so could increase murder rates. Reviews of capital cases reveal fairly high rates of serious legal error – around 65% - with many reviews reaching the conclusion that a much lighter sentence was warranted and 5% actually reaching the conclusion that the person was innocent. The introduction of DNA analysis increased the latter percentage substantially. In other words more than 1 in 20 (possibly 1 in 10) people on death row did not commit the crime they were accused of.

Most of the world has abolished capital punishment and although support for its reintroduction has fallen in the last decade it is still either a majority position or close to it. In the USA capital punishment is clearly a majority preference but what is the preference of the more intelligent public? Well to be frank a large majority of intelligent people also support capital punishment for murder. The proportion with IQs above 120 who support capital punishment dropped from 74% to 62%. The Smart Vote however isn’t about what the majority of intelligent people support. It’s about the direction in which opinion changes as intelligence increases. If the problem is tough it is possible for most bright people to get the answer wrong but more of them should get it right than the dull. The Smart Vote is therefore the alternative with the highest ratio of smart to stupid support. It turns out that the Smart Vote has been consistently opposed to the death sentence for murder since 1974 and is probably becoming increasingly so. See the graph below. The ratio of smart to dull opposing capital punishment rises from 1.25 (it’s multiplied by 100 to remove decimals) to over 2 and never gets close to 1.


Of course it is possible that the reason smart are more likely to oppose the death sentence than stupid people has no direct connection to being smarter per se. It could be that they are less likely to be victims and feel less threatened or it could be that they get more education and are indoctrinated by liberal professors, etc. So to control for such possibilities I performed a logistic regression where many confounding factors were entered into the model with IQ. The results are in the table below.


As expected, conservatives are more likely than liberals to support capital punishment – so too are men rather than women. Whites are much more likely than blacks, and the rich more likely than the poor, to support it. Age has no relationship. Neither does time period have a linear relationship – because support increased first and then decreased. As hypothesized above, exposure to more education does reduce support for the death sentence but IQ nevertheless remains independently significantly and strongly associated with opposition to capital punishment after controlling for all those factors. This raises the likelihood that intelligent opposition to capital punishment is not simple bias but is based on the relative merits of the case against it.

Next we move onto the issue of increasing or reducing the harshness of sentencing in general. An overwhelming majority of people want courts to impose harsher sentences on criminals than they already do - never dropping below 71% and having been as high as 92%. Only 7-10% of people ever expressed a wish for sentences to be less harsh. What about the more intelligent public? For those with IQs above 120 (brightest 10%) support for harsher sentences ranged from a low of 58% and a high of 90% and support for lighter sentences ranged from 0-15%. Again even in very bright circles you are much more likely to hear calls for heavier sentences than lighter sentences. Also again however the Smart Vote is different. See the graph below showing the Smart Vote over time for Heavier, Lighter or Unchanged sentencing.


It turns out that the Smart Vote is for courts to keep the harshness of sentencing at current levels rather to either increase or reduce it. There is a modest shift of the Smart Vote away from lighter sentencing during the late 80s and early 90s followed by a shift toward lighter sentencing and away from heavier sentencing from then on. This shift coincides with the initial climb in crime rates to the peak in the early 90s and then the unexpected drop in murder (and overall crime) rates from then onward. In other words the Smart Vote on policy is sensitive to conditions. Never in favor of heavier sentencing, the Smart Vote nevertheless thought it a mistake to lighten sentences when crime rates were very high and increasing, but shifted noticeably toward lightening sentences when crime rates dropped.

What about the issue of bias? The usual regression results shown below indicate that whites, women, the richer, older or the more conservative are more in favor of harsher sentencing than blacks, men, the poorer, younger or more liberal. Exposure to more education makes people less inclined to support harsher punishment. The association of IQ with opposition to harsher punishment is still evident after all these controls.


Greater intelligence points away from harsher punishment of criminals even when crime rates are high and rising and moves toward lighter punishment when crime rates drop. Like the Smart Vote on capital punishment this flies in the face of prevailing opinion implying that prevailing opinion is stupid and probably wrong.

What about spanking children in order to discipline them? Virtually all adults will have been spanked at some point by their parents (if not their teachers) when they were children and will have heard the words of wisdom “Spare the rod and spoil the child”. Most think spanking is the only way children can be disciplined since they seem to lack self control in the absence of strong incentives. Even those who don’t think spanking is the only way to discipline children often concede that it is a very efficient way. It should come as no surprise therefore that a large majority of people are in favor of spanking children to discipline them. Between half and two thirds of the top 10% brightest are also in favor of spanking children.

The Smart Vote is however opposed to spanking to discipline children. Look at the graph below. The ratio of smart to stupid opposition is appreciably higher than 1 (100 to get rid of decimals) for the last 23 years. In fact the graph understates the opposition. The categories Disagree and Strongly Disagree are combined in the graph. The Smart Vote is actually for Strongly Disagree with spanking to discipline children. Alternatively the Stupid Vote is for Strongly Agree. The ratio is declining over time simply because the overall population is moving toward opposition to spanking.


Could this just be bias? The usual regression to control for confounding factors says no. The results table below shows that blacks, men and conservatives are stronger believers in spanking children. It also shows the decline in support over the years. Exposure to education strongly reduces support for spanking. Considering that almost three quarters of psychologists oppose spanking it’s not surprising that this view has filtered through higher education. Finally the association between IQ and opposition to spanking is still strong in spite of the control exercise. In short the smart thing is not to spank kids in order to discipline them. Animal trainers have shown that you don’t even need to strike animals to make them obedient or do tricks so why should it be any worse with children?


Conclusion

In all three cases the Smart Vote is against harsh punishment and in all three cases it flies in the face of conventional wisdom. Pinker’s book and the Smart Vote have shown that the world is slowly becoming wiser on this issue. Nonetheless most people still stupidly cling to unnecessary harsh treatment as a means of managing the behavior of others. The chances are good that the world would be a better place, and probably their lives would be better too, if they didn’t.

Wednesday, November 16, 2011

What is Intelligent Opinion on Military Spending?

World defense spending amounts to $1.63 trillion, or 2.6% of world GDP. Spread over the same time period as WW2 this is equivalent to 95% of the absolute cost of WW2 (using the GDP deflator to standardize value). In terms of share of GDP global military spending is about 1/6 of the level of military spending for WW2.

Every country has an army (except Costa Rica) and some countries devote an extraordinary large proportion of their resources to maintaining one. WW2 mobilized 4% of the world’s population and participants devoted 32% of their GDP to the war. According to the Stockholm International Peace Research Institute North Korea spends about 25% of its resources on its armed forces and has 5 % of its population on active duty. The US alone accounts for 42.8% of global defense spending and with China account for 50.1% of all military spending. Other countries spend quite little. About 20% of the world’s nations spend 1% or less of their GDP on defense and about 9% spend 3% or more of their GDP on defense. So a significant fraction of the world values defense at least 3 times as much as another significant fraction. Which of the two approaches is the wiser – hawks or doves?

One way to approach this is to look at the correlation between the mean IQ of each country’s citizens and defense spending as a percentage of GDP. It turns out to be zero. Another way is to look at opinion within countries. Ideally one would like to see how opinion varies with IQ within low defense spending countries and high spending countries. If there is a trend for the brighter citizens in both groups toward high defense spending intelligent option would be for being well prepared militarily. If the trend in both groups is for the smart to support less defense spending then pacifism may be the intelligent policy. If there are different patterns in each group then there is either an optimum degree of defense spending or it may be smart for the well armed to continue their arms race and for the rest to drop their arms altogether. Unfortunately I only have data for opinions of defense spending by IQ in one country – the USA. I can however use this data to answer part of the question.

The USA is one of the high defense spending countries – at 4.7% currently it spends roughly 4 times the global median on defense as a percentage of GDP.

Lets have a look at the Smart Vote says. Recall that the Smart Vote is based on the ratio of the proportion of people with IQs greater than 120 and the proportion of people with IQs less than 80 who support a particular choice. The ratio is multiplied by 100 to get rid of the decimals. The Smart Vote is the choice with the highest ratio at any point. All the opinion and IQ data comes from the General Social Survey.

Firstly the Smart Vote is decidedly for being interested in military policy.

Secondly in 1984 the Smart Vote expected an escalation of the arms race to be moderately likely, a reduction in nuclear arms to be moderately unlikely and the elimination of atomic weapons to be very unlikely before 1994.

Thirdly in 1984 the Smart Vote expected an all out nuclear war to be highly unlikely, a conventional war to be moderately likely and repeated guerilla wars to be highly likely before 1994.

Fourthly the Smart Vote didn’t expect the US to be involved in a conventional war between 1976 and 1992.

Fifthly in 2000 the Smart Vote considers terrorist threats from US citizens to be the same or larger than 10 years ago. All these expectations proved accurate.

Nonetheless in 1984 the Smart Vote considered military service in war or peacetime to be moderately important but not at all an obligation and before 1973 was for taking part in anti-war protests.

In spite of being against the use of conscription, and pro the exemption of conscientious objectors, the Smart Vote concludes that an all volunteer military hasn’t worked out well - somewhere between “Worse” to “Only Fairly Well”. The Smart Vote on Confidence in the Military over time confirms this. One can see in the graph below that the Smart Vote has been for “Hardly Any” confidence in the military up until the early 90s and since then somewhere between “Only Some” and “Hardly Any” confidence. The Stupid Vote (the lowest ratio of smart to dull opinion) has consistently been for “Great Deal” of confidence in the military. On the other hand the Smart and Stupid Votes have been converging a little over the last generation. In a related question the Smart Vote was for not being proud of America’s military record.


What about the question we started with – military spending? The graph below shows the Smart Vote on more, unchanged or less defense spending over the years and compares this to actual defense spending trends. The defense spending figures come from US budget history. I converted defense spending to an index by dividing the percentage of GDP spent of defense by 5% and multiplying by 100 to get rid of the decimals.

You can see that the Smart Vote has been consistently for less defense spending and that until the mid 1990s the Stupid Vote has been for increased defense spending. How much less spending? A question on how much less or more military spending people prefer was asked in the 1990 and 1996 and revealed that the Smart Vote is for much less military spending rather than just moderately less.


The Smart Vote ratios might reflect interests that just happen to coincide with IQ, in which case the above wouldn’t be intelligent opinion so much as a bias. I checked that possibility with a multiple regression. More versus Less Military spending was the dependent variable and IQ, political ideology, age, sex, race, date, income and education the independent variables. The table below shows the strongly significant independent relationships and their direction.


As expected ideology has a very strong effect on preferred military spending. Conservatives want to spend more and liberals less. Also preferring to spend more on the military, again as expected, are older people, whites and the wealthy. An unexpected finding was that women do too. There is a trend toward favoring ever less military spending over the years. Time, race and gender effects are very weak.

The important thing for the Smart Vote is that the relationship between higher IQ and favoring less military spending is still plain even after controlling for all these interest variables (that do in fact influence opinion). So the Smart Vote on this issue is less likely to be an artifact of bias and more likely to be a function of real insight and wisdom. Note that higher education leans toward less military spending independently of IQ and income. I interpret that to mean that not only does higher individual intelligence predispose one to want to reduce investment in the military but so does exposure to the intelligence and learning of others.

Intelligent opinion within the US has been accurate in its expectations of global military developments but nevertheless had little confidence or pride in the military, and believes that America should reduce its investment in military capacity substantially.

Given these consistently dove like preferences one could reasonably ask whether the Smart Vote is for outright abolition of the military, like Costa Rica. One way to guess at this is to regress the variations in Smart and Dumb Votes onto the variations of actual military spending over time. I did this after smoothing the saw tooth pattern in the Smart and Dumb Vote graphs above.

The correlations were -0.695 for the Dumb Vote ratio and 0.724 for the Smart Vote ratio.

The regression equations were
-0.848*Spending Index +143.85 = Dumb Vote ratio, and
0.824*Spending Index + 99.4 = Smart Vote ratio.

The Dumb Vote ratio is expected to exceed the Smart Vote ratio i.e. spending more will become as intelligent an option as spending less, when the spending index drops below 26.6. This is equivalent to spending 1.33% of GDP on defense. So the answer is no, zero defense spending isn’t the intelligent option for the US – there is an optimum at 1.33%. This amount of spending will still exceed the defense spending of China, Russia, North Korea, Iran, Iraq and Afghanistan put together so the US will hardly be seriously threatened even if it did reduce its spending to less than 1/3 of what it is now i.e. from 4.7% to 1.33% of GDP - $500 billion less.

An important question is why the Smart Vote is for less military spending in the US. The attitude of the US to international organizations has some relevance. A preference for less military spending tends to go along with a preference for the US staying in the UN and playing an active role in international affairs; a belief that the UN has too little power and that international organizations do not take too much power from the American government; and that the US should not follow its own interests if this were to lead to conflicts with other countries. Preferring less military spending also goes with believing that the UN should intervene if human rights are seriously violated. The Smart Vote is decidedly for all those views. That points toward the desirability of the US shifting away from isolationism, or American exceptionalism, which require bigger military defenses, and toward greater diplomatic and cooperative ventures, which would require a level of arms more in line with international practice.

Intelligent opinion in America thinks the US should try to be less offensive and more cooperative in international relations.

Friday, October 7, 2011

The Smart Vote Concept

In the previous post I briefly introduced the concept of The Smart Vote. In this post I spell it out in detail because I will be using it frequently in future posts.
There are always arguments about political policy, or about social, economic and religious issues, with people on all sides thinking their own position is the one that makes obvious sense; but can one objectively establish if one position make more sense than the others, and if so can we identify it? I think differences in intelligence can help point the way.

The essence of the Smart Vote concept is as follows.

If there is no difference of opinion by intelligence then reason is not relevant in deciding between them and none of the opinions being considered is more correct than any of the others. However if opinions do differ systematically with intelligence then relatively more correct or better alternatives probably do exist, and that they are those relatively more favoured by the more intelligent. Statistical differences in the independent opinions of people of different intellectual ability point to the most reasonable responses to controversies.

Intelligence as correctness

An essential attribute of any concept of intelligence is that the smart should be better than the dull at finding objectively correct answers to problems, where such answers exist. In fact this attribute is almost always used when attempting to measure differences in intelligence. Tests usually present problems that have objectively correct answers and then require the person to find them if they can. Those who are more adept at this are deemed relatively smarter than those who fail. This inference is only valid when all those taking the test are roughly equally familiar with the kinds of problems used, but in general that condition is largely satisfied.

One well established finding is that the ability to find correct answers to one kind of problem type e.g. arithmetic, says a lot about the ability to find correct answers in other problem types e.g. reading comprehension. Smartness with one problem type tends to go with smartness in all other types – no exception has ever been identified. Being smart is, at the very least, about the ability to find correct answers to all problem types. Even if that wasn’t the case individual intelligence tests (IQ test) present the person with a wide array of problems, so it is only possible to achieve a high IQ score if one is reliably adept at finding correct answers to a wide range of problem types. Getting all the arithmetic and none of the other correct answers will not get you a high IQ score. Likewise it is only possible to get a low IQ score by consistently failing to find most of the correct answers on all the problem types. IQ therefore is a measure of one’s general propensity to find correct answers.

This is all very well when dealing with unambiguous problems that do have clear objectively correct answers, but in most of life the answers are highly uncertain. Is intelligence of any use there? Yes indeed. Somewhere in between objective and uncertain problems there is a kind of item made up of mutilated pictures of well known objects. A mutilated picture is almost like an inkblot test, where what you see is determined by your own psychological makeup. With inkblots you impose your biases onto the picture and sort of see what you want, or need, to see. In theory what you see says nothing about the picture and everything about you. Mutilated pictures however have proved to be superb intelligence test items. People who score high on objective tests are better at guessing the actual original object from random partial bits of its image i.e. the smart are more likely than the dull to impose or project the correct meaning onto the bits and pieces left over.

Similarly, there are an infinite number of correct responses to any number series. Some of course involve less complicated principles than others and it is usually the simplest principle that the test designers have in mind when constructing a number series. Those who are good at objective problems tend to select the correct answers that the test designer had in mind rather than any of the infinitely many others. So again people smarter on problems with a single objective answer are better at finding the best answer when there are many correct answers.

Then there is achievement in life. All things considered, on average (for people who start at the same level) those who end up better off – wealthier, healthier and more respected - will tend to have picked the better alternative whenever they faced a choice. Many of those choices would have been uncertain. The choices may have involved more than one reasonable option or have been controversial. On average, those who are good at finding objective answers are better at these messy choices and do better in life. For example the average of the upper, middle, working and lower classes in the US are at the 69th, 60th, 43rd and 27th percentiles of intelligence respectively. Professionals like doctors, lawyers, engineers, accountants, CEOs and even US presidents are on average at the 93rd percentile. Top thinkers such as elite scientists or supreme/appeal court judges are at the 99.9th percentile.

Men who make choices that see them serving time in jail typically score at the 27th percentile. A large part of that is because dull men are more likely to commit crimes serious enough to warrant jail time. However brighter men are also more likely to make choices less likely to see them get further into trouble at every possible step between committing a crime and going to jail. They are less likely to be identified but if identified less likely to be arrested; if arrested less likely to be prosecuted; if prosecuted less likely to be convicted and if convicted less likely to be jailed. Brighter criminals at large are less likely to be caught and if caught it tends to take longer. If jailed brighter criminals are more likely to escape or be a model inmate and get time off.

Women who give birth out of wedlock average at the 35th percentile of intelligence.

Humour is to a large extent subjective, and whether someone will laugh at one’s jokes or wit is highly uncertain. Nonetheless some people get it right far more often than others and those that do get it right tend to be disproportionately smart. IQ testing of the top 50 or so stand up comedians in Britain found that they averaged at the 97th percentile and none were below the 90th percentile of intelligence.

So, intelligence is relevant and important when it comes to finding good answers to problems, even when the situation is uncertain and the answers fuzzy. If there is a correct answer to a problem then the opinion of the smart person is more likely to be correct than that of a dull person.

Using intelligence to point out the correct answer

Suppose you can’t use the content of the problem to identify the correct solution. This usually means you personally can’t answer it. You can ask for help. Suppose no one is around to ask but you do have data on the answers of the smartest and dullest 20%. Consider the following actual 5 item science test from the General Social Survey. Each question had 4 different possible answers - A, B, C or D. The numbers are the percentage of each row that chose that answer.


The correct answers were 1 D, 2 A, 3 D, 4 A and 5 D.

The test was tough. It was unusual for any item to be picked by more than half of either group and the mean score of the smart and dull groups was 42% and 15%, respectively. Pure guessing is 25%.

Note that it wouldn’t be much help to go on the opinion of individual smart people. On this test even they were wrong more often than they were right. On the other hand the average of the independent judgements of a diverse group of people is often very accurate (Wisdom of Crowds) and betting markets are astonishingly good predictors. Not all crowds are equally accurate however. Quite frankly the ‘wisdom’ of a crowd of dull people can be very unreliable. For example if we went along with the most popular choices of the dull group on each of the test items we would have netted no correct answers at all. On the other hand if we went along with the most popular choices of the smart group we would have netted 4 correct answers out of 5 – much more than the average total score of that group. So the difference between the average ‘wisdom’ of groups of dull and smart people is even starker than the differences between individual dull and smart people. I’ve shown this with a concrete example but it is true mathematically.

Members of each group share a particular level of intelligence (or propensity to find correct answers) and whatever factors they don’t share will tend to cancel out in the average opinion. The difference in the percentage of each group that picked an answer will therefore reflect a distilled difference in ‘propensity to be right’. The Smart Vote makes use of this difference in distilled propensity to find correct answers.

In the Smart Vote it is not the most popular answer of the smart group that matters but the largest difference of opinion between the smart and dull groups. The percentage of smart and dull groups choosing each answer is compared and the largest ratio of the smart to dull percentages is the Smart Vote. For example for Item 1 the ratios were

A 2.4/17.7 = 0.14
B 13/42.3 = 0.31
C 21.8/28.5 = 0.76
D 62.8/14.5 = 4.33

The largest ratio was for alternative D so the Smart Vote for Item 1 would be D – which is the correct answer. The Smart Votes for the other four Items were 2 A, 3 D, 4 A and 5 D – all correct - so the method proved 100% accurate even though the average total score of the smart individuals was only 42%. The probability of that happening by chance is less than 1 in 1000.

I have repeated the above experiment on many different tests with objective answers, always with 100% accuracy. To some extent it’s to be expected that the correct answer would be picked more often by the smart because the item would be a bad measure of intelligence if it wasn’t. On the other hand there is no reason why one of the several wrong answers shouldn’t show a larger ratio in favour of the bright than the correct answer. So there is no necessary reason why the method should be so accurate, but it is.

Going beyond questions with objective answers

Guessing the correct answers to IQ or science test items is not the point of the method. The aim of the method is to shed light on controversies. The answers to test questions are in a sense controversial in that even the very bright clearly don’t initially agree, but they do agree following some explanation. Unfortunately agreement on religious, social and economic controversies is harder to come by.
One’s grasp of the meaning of a controversy and understanding of what is at stake should increase with increase with intelligence, both because of the greater capacity to reason through the complexities and the larger stock of information that intelligent people tend to collect. If differences in intelligence make a difference to the understanding of controversial issues they should also make a difference to opinions formed. At the very least careful intelligent thought should be relevant.

To the extent that ‘correctness’ is relevant to a particular question those with a higher propensity to find correct answers should reach different conclusions to those less able. In other words, if ‘correctness’ is meaningful for an issue then on average the smart and the dull will tend to have different opinions. Logically, no association between IQ and opinion proves that cognitive factors aren’t relevant to the controversy. However the presence of an IQ-opinion association does not prove that intelligence is relevant – it only suggests that it is quite likely. In my view the likelihood is very high, especially in view of how well the method performs on objective questions.

An objection to the Smart Vote

People tend to vote for what is best for them personally and smart people may simply have interests in common that are different to the interests shared by dull people. The defining features differentiating the two groups may not be IQ alone but some interest too, and the average opinion of each group will distil the interest differences as much as they do intellectual differences. For example, IQ related differences in musical taste may simply reflect the fact that IQ relates to social class, and that it is class prejudice that explains the differences musical taste rather than any application of thinking to the relative merits of musical forms per se; or a difference of opinion on welfare measures may simply reflect that dull people are more likely to be recipients, and smart people contributors, to welfare.

On the face of it this is a compelling objection. My first response is that this isn’t always a factor. Political research shows that people frequently don’t vote their narrow selfish interests e.g. the elderly are less likely to vote for social security than the young and women are less likely to support abortion on demand than men. However there are enough cases where narrow interests obviously do play a role for it to be taken seriously. Fortunately this possibility can be dealt with by controlling for interest differences. For example we could control for class when looking at musical taste, income when looking at welfare, age when looking at social security policy, race when looking at affirmative action, etc.

I should point out that though it is possible that selfish interests may produce spurious associations between IQ and opinions they could just as easily hide real associations. For that reason too possible interests should be controlled.

Conclusion

When IQ is correlated to differences of opinion there is reason to believe that some opinions are in some degree better than others and that the most reasonable opinion is the one with the largest ratio of smart to dull favouring it. This is the Smart Vote. A related concept is the Stupid Vote which is simply the opinion with the lowest ratio of smart to dull favouring it. The Smart Vote is not necessarily the opinion most favoured by the smart nor is the Stupid Vote necessarily the opinion most favoured by the dull – it’s the ratio that matters, not the level of support.

Tuesday, August 16, 2011

Intelligent Music Tastes


Although people do talk about taste as though it can obviously be ordered in terms of good to bad, most would be hard pressed to come up with a good reason justifying those judgments. Indeed, upon reflection they would probably concede that taste is simply a given and that judgments on the relative merits of different tastes boil down to prejudice. After all, one cannot really say that there is something wrong with liking, or not liking, peanut butter. Some say that tastes are just the way we were wired at birth, but that’s not entirely true. We do inherit different amounts of the various kinds of taste buds so the same food may taste different to each of us right from the start. Nevertheless our food preferences – like our religion and many other things – are usually those we were raised with. Preferences are also conditioned by subcultures as well as individual or random associations.

So if tastes are largely determined by genes and culture does that mean they are beyond comparative judgment? Politically correct opinion these days is that it is simply prejudice to say that one culture is better than another. That’s a bit short sighted. When you look at some aspects of culture it becomes obvious fairly quickly that some variations are better than others. For example the Arabian number system that we all use today is clearly an improvement on the Roman number system; writing was a big improvement over having people remember everything; the adoption of systematic error correction - in the scientific method and in legal procedures - has improved our lives immensely; where cultures differ in the degree of senseless cruelty they accept, the more humane cultures are better in that respect, etc, etc.

In principle therefore we can make unprejudiced judgments on phenomena that are at least partially culturally determined. That judgment might legitimately take the form of saying that a taste is to some extent more or less intelligent than the alternatives. Or can it? The cultural aspect the person prefers may well be better than the alternatives but he may simply prefer it because he was raised with it and thinks “my culture is best”. That’s hardly being intelligent. What we need is some evidence that intelligence leans toward certain preferences within a pool of alternatives, within and across cultures and sub-groups.

We know that men like action movies more than women and that women tend to like romance movies more than men, but what we want to know is do intelligent men and women like action and romance movies more or less than the average men and women. Suppose 75% of men and 45% of women like action movies and 30% men and 80% of women like romance movies. If we find that 50% of very intelligent men and 85% of dull men like action movies (and the percentages are 35% and 50% of smart and dull women respectively) then we might conclude that action movies appeal to stupidity. Of course it doesn’t follow that romance movies would therefore appeal to intelligence. We might find a similar shift away from enjoying romance movies too. It might turn out that smart people disproportionately like ‘art movies’.

I was looking at various items in the General Social Survey and came across a number of questions on musical preferences and noticed that almost all of them correlated in some way with the GSS’s mini-IQ scale (a 10 item vocabulary test that correlates 0.7 with a full IQ scale). Many people I shared this with expressed a great deal of skepticism about the notion that musical preferences could be better or worse – let alone smart or stupid. Some suggested the correlations I noticed must be an artifact of say socio-economic status being partly a function of intelligence and that the music tastes simply reflect the SES differences. On the other hand SES may be related to music taste because it reflects intellectual differences. One of the virtues of the GSS is that it allows one to test such hypotheses.

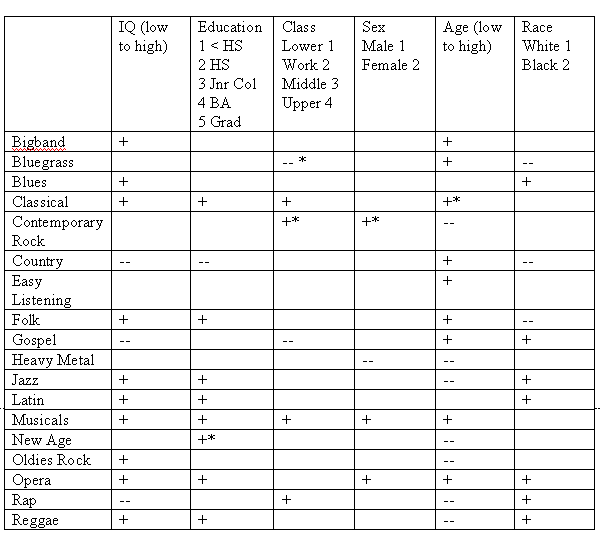
Class and education, race, sex and generation each represent an obvious subculture with respect to music preferences. Who hasn’t heard someone say that classical music is pretentious, that show tunes are for women and gays, that blacks like rap and jazz and whites country, or an old person say the music of today’s youth is just noise? If music tastes are to some degree really due to intelligence then I need to show that intelligence is still related to music preference even after accounting for these sub-cultural influences. Multiple regressions are a statistical technique that allows one to look at the influence of each sub-culture, and of intelligence, independently of each other. So I ran a multiple regression on the degree to which each type of music was liked or disliked, using the vocabulary scale, social class, race (black and white only), sex, age and amount of education as independent variables.

In the table below I show whether the relationship was significant (unlikely to be due to chance) and the direction of the relationship.


- A * indicates significance at the 10% level, all others are at 5% level.

Some well known results pop out - we see that being black increases the chances that you will like Blues, Gospel, Jazz, Latin, Opera, Rap and Reggae, and reduce the chances of liking Bluegrass, Country and Folk. (OK so Opera was a surprise to me.) Older people are less likely to like newer music, like any kind of Rock, Jazz, New Age, Rap or Reggae, and more likely to like older music genres, than the youth. Women like Musicals more, and Heavy Metal less, than men. Classical music does live up to its pretentious reputation but strangely Rap is an upper class taste too.

Also note that the racial, class, gender and generational differences in taste cut across both smart and dull tastes i.e. are not due to intellectual differences between any of these groups. However educational differences in taste do track IQ differences in taste – even though the two factors are independently evaluated in the analysis. One would expect that the role of education would reflect intellectual factors but here it reflects the intelligence of those who designed the curriculum, rather than that of the student.

The interesting result is that IQ is frequently significantly related to how much people like or dislike music. Even after the cultural influences are accounted for 13 of the 18 music genres still show a relationship to intelligence. Furthermore the independent effect of intelligence is usually relatively strong – about equal to all the cultural influences combined. Clearly differences in music tastes are partially due to differences in intelligence, and the connection isn’t explicable in terms of arbitrary connections between IQ and culture.

But what is it about the music that appeals to intelligence or stupidity? One way we can shed light on this is to look at pairs of musical tastes that typically coincide – in the sense that if you like one kind of music you are very likely to like the other. If one of the pair correlates with IQ and the other doesn’t, then we can use this to isolate the intellectually relevant appeal of the music. A liking for Rap tends to coincide with liking Reggae, Jazz and Blues, and the 4 share features that appeal to some people and which others dislike. In the Table you see that the latter 3 are positively related to IQ while enjoyment of Rap is negatively related. What this implies is that it is specifically not those aspects which Rap shares with Reggae, Jazz and the Blues that is relevant. It is what is unique about Reggae, Jazz and the Blues on one hand, and Rap on the other, that taps into the intellectual side of taste. We would need to zero in on what makes people like Reggae, Jazz and the Blues that wouldn’t help them like Rap, and visa versa.

Similarly I found that what separates Folk music from Country & Western or Gospel music, and what separates Oldies Rock from Contemporary Rock and Heavy Metal, also isolates the intellectual side of musical tastes. There is something in Folk music that Country music doesn’t have (or something unintelligent in Country that Folk doesn’t have). There was something in Early Rock music that the Rock music of today, and Heavy Metal, is just missing. What did Jazz have that Rap has lost, or what features has Rap introduced (which appeal particularly to the dull) that Reggae and Jazz never had? The answers aren’t immediately apparent and I’m afraid the GSS data doesn’t have any more to add to the subject.

I would be willing to bet that with the right data I would find that intelligence is relevant to taste differences in the visual arts too i.e. paintings, photos, interior decoration, clothing and hair fashions, architecture, car design, jewelry, etc.

A concept I’d like to introduce here is something I call The Smart Vote. This is based on the notion that IQ is the ability to be correct given a fairly standard experience with the subject matter. High IQ people have shown that they are reliably correct and low IQ people that they are reliably incorrect, across a wide range of subject matter and problem types. So where high IQ people agree on a different answer to that agreed upon by low IQ people, the chances are extremely good that the high IQ preferred answer is correct. The Smart Vote is not what the majority of smart people prefer but rather the direction in which their preferences differ from those of the dull. Where a systematic difference of opinion between high and low IQ groups exists, it usually points to the most correct alternative.

I have shown that The Smart Vote exists for music tastes and that it isn’t accounted for by cultural influences, so it would seem that musical tastes can probably be correct or incorrect. Good and bad taste is not merely prejudice.

Thursday, July 28, 2011

Life Expectancy - the Blue to Red Zones

There is a lot of interest in increasing life expectancy. Who after all doesn’t wish to live longer? Since life expectancy differs markedly across countries researchers have naturally tried to tease out the reasons. Some obvious findings are that high levels of infectious diseases lower life expectancy, and wealth and good medical care increase it.

One of the ideas being bandied about is that dietary differences are important. The reasoning is that once you control infectious diseases life span depends on the lack of degenerative diseases like heart attacks or cancer, and there is a fair amount of evidence that unhealthy diets are a major cause of degenerative diseases. The appealing thing about the focus on diet is that it is something we can control.

Unfortunately there is disagreement (even among experts) about what the ideal diet would be. Some look at the association between saturated fat consumption and degenerative diseases and emphasize a plant based diet. Others insist that large quantities of carbohydrates, not fats, are the central cause of degenerative disease. Some swear by good fats e.g. olive oil, nuts and seeds and fish, and red wine. Some blame dairy products for a lot of health problems while other researchers say that milk consumption actually lowers belly fat and that Sardinians live long lives on a lot of goat or sheep milk. There seems to be no end to the arguments. One way to sort this out is to look at which populations live long healthy lives and note what they eat. The problem with this approach is that there are always confounding factors that muddy the picture. So I applied my mind to ways of isolating the effect of diet.

The first thing that occurred to me was that infant mortality reflects disease load, hygiene and quality and availability of medical care. So life expectancy - controlling for infant mortality - should isolate the relevant lifestyle and dietary factors. The second thing that occurred to me was that although the effect of wealth on disease control, health care and hygiene is captured by infant mortality it also plays a role beyond medical factors e.g. safety. So it would be worthwhile to control for GDP per capita too. The third thing that occurred to me is that mean IQ is strongly correlated to infant mortality, life expectancy and GDP per capita. IQ would be a major confounding factor so I controlled for mean IQ too. IQ and GDP per capita might be called ‘means to health’ factors. IQ alone accounts for 54% of the variance in life expectancy and GDP per capita adds another 3%.

I initially ran a regression on life expectancy with infant mortality, IQ and GDP per capita as predictors, and looked at the residuals. What struck me was that all the countries with high AIDS rates were clustered at the bottom. So I added AIDS prevalence (and then later smoking) rates, as additional predictors.

Interestingly I found that the ‘means to health’ factors do not add much to predicting life expectancy, once the effect of infant mortality is controlled for. This doesn’t mean that the ‘means to health’ factors only work by reducing infant mortality. It means that the ‘means to health’ factors work on what infant mortality and life expectancy have in common. I think it lends credence to my initial assumption – that infant mortality is a good proxy for disease load, hygiene and the availability and quality of medical care.

The regression was extremely accurate – accounting for 92.4% of the variance in life expectancy in 185 countries. Infant mortality and AIDS alone accounted for 90.2% of the variance. Clearly life expectancy is mainly about avoiding diseases and getting good medical care. Improving disease control and medical care, to the extent that every country would have an infant mortality equal to the current minimum and a zero AIDS rate, would move average country life expectancy from 70 to 78 and reduce the standard deviation from 10 to 3.8. There would still be a good 5 years difference in their life expectancies of the top and bottom 20% of countries. These differences would mostly be accounted for by diet and community – in other words, lifestyle differences.

So lets look at which countries have the healthiest lifestyles (outside of disease control, hygiene and wealth and safety). The map shows the results according to the following color codes. The figures are years above or below expected.

Red - <=-4 years Orange -4 to -2 years Yellow -2 to 0 years
Green 0 to +2 years Light blue +2 to +4 years Dark blue => +4 years


You can see that certain regional trends are evident. Firstly there is a tendency for bad lifestyle countries to be in the same regions. Most of Asia; South, Central and West African; and the Arabian Peninsula, would have below average life expectancies if all countries had the same IQ, disease and AIDS rates, wealth, medical care and smoking habits. East and Northern Europe would also be below average. You can’t see it on the map but all the Pacific Islands would tend to be bad too. I call the worst of these, Red Zones. They are of course red on the map.

On the other hand South Western (or Mediterranean) Europe would have above average life expectancy residuals. North Africa, the Middle East and the South West Asia and Caucasus region are good. So are East Africa, and Japan, Thailand and Cambodia. The whole of the Americas are good - especially the Central and South parts. Not seen on the map is that the Caribbean Islands are also above average to good.

Some of this isn’t a surprise. The so called Blue Zones (Sardinia, Italy; Okinawa, Japan; Loma Linda, California; Nicoya Peninsula, Costa Rica, and Icaria, Greece) all fall within the latter group of countries. Blue Zones are places where high percentages of the adult population live to very advanced ages – at least 90 and often 100 - in good health and in a functional state. The really good areas are therefore blue on the map, with dark blue being outstanding.

There is a literature on these Blue Zones which is well worth studying. However the map suggests that places other than the already identified Blue Zones should be looked at too. Spain, Portugal and North Africa stand out and have some dietary and lifestyle affinities with Sardinia, Icaria and the Mediterranean region in general. So too does the Middle East (outside the Arabian Peninsula) and South West Asia/Caucasus region. East Africa is another region (with Middle Eastern influences) worth studying. Georgia is particularly interesting for several reasons. It is an especially good zone (dark blue) and was once it was rumored to be the location of a Blue Zone. The Caucasus area in general is good but transitions to very bad as soon as one gets to the non Caucasus parts of Russia.

Then there are a host of Central and South American countries other than Costa Rica that come up as blue on the map, so the dietary and lifestyle traditions of this whole region bears looking at. An interesting finding is that adult Hispanics in the US live longer than the much wealthier US white adults. Presumably they maintain some of their diet and lifestyle traditions after emigrating.

The USA is usually the poster child of bad lifestyles and diets. The USA is in fact bad relative to the best but it turns out that so many countries are even worse that the USA turns out to be above average.

On the other side of the picture are those sad countries who diets and lifestyles one would do well to avoid – the Red and Orange (and maybe even yellow) Zones. What is wrong with the diets and lifestyles of Southern, Western and Central Africa? Why are Russia and the former Soviet Union so bad? Why is Northern and Eastern Europe below average? Why are India and China below average?

The Blue Zones have certain things in common. They all favor plant based foods - particularly legumes (from Fava, soy and pretty much any beans to chickpeas and lentils), whole grain cereals (wheat, corn and maybe rice), high nutrient fibrous vegetables, starchy yellow vegetables (sweet potato and pumpkin) and nuts. Fruit seems to be something consumed in moderation. Yogurt is also common in these regions. Of course their consumption of foods not on the list is very low. They all have high levels of moderate activity and some sunshine as part of their daily lives. Their lifestyles are ‘chilled’ rather than time urgent and they have very high levels of social engagement within extensive and supportive social networks. Red wine and olive oil (oily fish) is a common factor around Christian Mediterranean areas. Smoking is something they all avoid.

Georgian cuisine is built on wheat and corn, beans, olive oil, walnuts, lean poultry, some red meat (mostly lamb but also beef and pork), freshwater fish, vegetables (mainly eggplant, a variety of spinach and mushrooms) and a strong yogurt and some cheese. The alcohol is wine or a grape based spirit. In short it is very much a Middle East/Mediterranean diet i.e. plenty of low glycemic index carbohydrates, healthy fats, yogurt and wine and few bad fats, refined carbohydrates or root vegetables. Living in the mountains makes for plenty of exercise whether you like it or not.

The unfortunate thing about these diets and lifestyles is that are generally those of the poor, and most of those very people would prefer not to eat and live like that. As soon as they become a little wealthier they start eating a lot more meat, fat, refined carbohydrates and calories overall.

That’s all very interesting but if the Red Zones follow similar diets and lifestyles the importance of those commonalities falls flat. Fortunately there are differences. The Russian diet is a case in point and is pretty bad. It is high in fatty meat, oil (not olive or fish), root vegetables (potato and beets), eggs (typically fried), salt, vodka and refined wheat and is low on vegetables, fruit and legumes. It emphasizes high calories – something regarded as self evidently good and healthy in Russia. This is in direct contradiction to experiments showing that lower calories (provided nutrient levels are high) result in longer life spans.

The staple diet of much of Southern, West and Central Africa are heavily based on starch – either root vegetables or grain (mostly refined) – and fatty meat (in stews or grilled). Although meat is favored many of them don’t get much (through poverty) and suffer protein deficiencies even though they eat enough calories to get fat. East Africa and the Horn use more legumes and milk and less meat in their diet. The Arabian Peninsula differs from the rest of the Middle East in that they eat relatively more meat (mostly chicken, sheep and goat). Northern European diets are heavy of fatty meat, cheese, potatoes and bread. The South Sea Islanders eat a lot of meat (and not as much fish as you would expect) and also starchy root vegetables like cassava. These Islands have some of the highest proportions of people overweight in the world. The Chinese and Indian diets have too little variety – rice is eaten for almost every meal – and too little protein. They eat so little protein in fact that the amount provided by hapless insects in the unhygienic vegetarian fare of poor Indians is enough to make them appreciably healthier than vegetarian Indians in countries where the insect load in food is lower.

The common denominators are high starch (root vegetables) and refined grain (and sugar) levels – and sometimes just too much rice - and a lot of meat (especially fatty meat). Too little protein plays a role in some places.

Advice

If you want to live longer then you would do well to try and adapt the Blue Zone principles to a modern and wealthier lifestyle but you don’t really want to live like the poor if you can help it. Try to take the traditional Middle Eastern/North African/ Mediterranean or Central/South American or Thai/Japanese (Okinawa) cuisine and give it a more gourmet twist. Develop a collection of 20 or so recipes from those cuisines. They should be simple to make and appeal to you i.e. be soul food rather than elaborate. Typically people only eat 10 different recipes over their whole lives so you don’t need to be endlessly creative. One good way is to substitute the ingredients of your habitual meals with ingredients emphasized in the Blue Zones and map areas.

The main ingredients are legumes of all kinds, whole grains, fibrous and leafy vegetables, nuts, yellow starchy vegetables (pumpkin/butternut or yellow/orange sweet potato), peppers, spices, olives (olive oil), yogurt (goat or sheep’s milk) and moderate amounts of low fat meats, fruit and red wine. No vitamin pills are involved but you probably wouldn't do yourself any harm taking a reasonable dose wide spectrum vitamin and mineral supplement regularly.

On the other hand any refined grain or carbohydrate is a no-no. Curiously root vegetables (especially potato) don’t seem to be good either. A recent study showed potato consumption accounted for 2/3 of bodyweight gains in the USA, and countries that have it as a staple tend to be Red and Orange Zones. Refined carbohydrates (bread and sugar) accounted for much of the rest of the USA bodyweight gains. Vegetable oils (other than olive oil) that don’t need to be refrigerated are also very bad. Very low protein is bad.

Try to exercise. Expensive gym memberships or formal workout programs aren’t necessary and aren’t part of the lifestyles of Blue Zones. Walking works and is a low stress convenient activity that can be combined with other purposes from just getting somewhere to thinking or walking the dog. There are lots of fun activities one can try too e.g. roller blades, physical games, even sex. In particular make sure you don’t spend much time sitting – especially when being passive, as in watching TV. Research shows sitting really does subtract the years off your life. A little flexibility and strength work is important too.

Develop your network of supportive relationships – friends, family and community. One can learn how to find people who interest you, to make more friends and how to cultivate them once they are formed. Increase the level of low level socializing i.e. not necessarily clubbing or going to expensive restaurants. Try to end bad relationships of all kinds – by either repairing rifts or dropping them altogether – because bad relationships are worse than no relationship. Help people regularly (because research shows that helping activities do increase happiness and welfare) but don’t let it become a duty that binds and weighs heavily on you.

While it helps to have a purposeful life (where your existence matters to other people) be careful not to let your purposeful life turn into a high pressure one. Try to trim the pressure and urgency from your life and adopt a more “chilled” approach to your purposive and necessary activities. Try to eliminate what isn’t necessary or important. Deliberate relaxation is very beneficial and socializing is better means than TV for many reasons. Yoga is something that can help to relax and some forms are also excellent sources of flexibility and strength work.

Wednesday, July 20, 2011

The Price of Religion

Ever wondered what religion is worth? Is it worth more than sex for example?

An interesting statistic on Google is the ratio of hits on sex versus God. It is 1.457. In the US the porn industry grosses about $14.36 billion per annum, which is a bit more than 1/6th of the money going to religion in the US (as you will see below). On the other hand the porn industry worldwide is larger than the revenues of the top technology companies Microsoft, Google, Amazon, eBay, Yahoo!, Apple, Netflix and Earthlink combined so sex seems worth quite a bit. People seem to need it.

Needs however are contingent. At base you need just enough food and water to survive and breeding (and even shelter) is a luxury. But if you regard breeding or sex as a necessity you will require much more of it. The interesting thing is that for sexual purposes it becomes important to have more than the other guy and no matter how rich everyone gets that will remain an important factor. A need then is something that is contingent on conditions and needs evolve as conditions change. Then there are needs that some people have that others don't. Responding to things depends partially on conditioning history and that is fairly individual. Even genes governing needs are not universal e.g. where you stand on the need for order versus flexibility in your environment, is highly heritable. So what is a real need for me may be no more than a wasteful whim to you.

Money spent on anything always involves an opportunity costs. For those who spend money on religion, sex or cigarettes it’s definitely worth it. For some people religion is a terrible waste of money whereas the amount spent on sex is insufficient. For an old man who has no testosterone left too much is spent on sex. Even if you do think your need or want is worth the cost it always involves a loss of the ability to satisfy other needs/wants. Naturally believers prefer to focus on the benefits of religion but atheists would be unable to appreciate the value of religion and would chose to focus more on the lost opportunities. We make decisions about what opportunities to actualize or let go so and if what I want to actualize you want to let go then we can help each other by trading. Once trading happens the market picks up on the relative volumes of supply and demand and assigns an optimum price. Money then becomes a universal measuring stick of the value of anything that can be traded. The oldest profession tells us sex can be traded for money.

Religion grosses $84.22 billion or 0.615% of GDP per year.

What about religion? In 2005 in the USA $42.11 billion (in 2010 dollars) was contributed toward religion (directly to churches). Churches use double their direct contributions - the rest coming from investments, rent, businesses, etc - so the true amount grossed by religion is about $84.22 billion. That's 0.615% of GDP. (₤1.78 billion in donations and ₤3.34 billion overall- or 0.3% of GDP - in the UK).

Religion provides $6.51 billion to charity per year.

For that money one could (at $102105 per new job) create 824868 new jobs and start roughly 75600 new small businesses per year. However since the church employs 2.6 million people one could say that religion creates a net 1.775 million jobs. It also provides on the order of $6.51 billion in charity. So as an investment religion seems to be worth it.

Religion accounts for 3.543 billion man-hours per year and an opportunity cost of $205.436 billion per year. The overall value of religion (adding money and time) is $289.656 per year

From the point of view of time things look a bit different. All churches together have 45 million confirmed registered and 100.84 million more unregistered members. The average number of actual church attendances per year is 16.2 (42% claim to go every week but checks find that only 26% do.) So at 1.5hrs per week spent in church - roughly 3.542 billion man-hours per year were taken up by religious activities. In that time 2.04 million Americans could have been busy in full time productive employment producing $58 in value per man-hour. That adds up to an opportunity cost of $205.436 billion in productive activity. If instead of going to church they spent the same time at their jobs they could have paid for the entire church enterprise - employees, buildings, charity – with a mere 20.5% tax on that extra activity. Alternatively they could have worked for an extra 2 days per year and donated the entire amount to the church.

The US could quadruple their science plus triple their reading with what they devote to religion.

So what could the US have bought with $289.656 billion? The obvious alternative to reliance on religion is reliance on rational enquiry. The US spends $23.24 billion on non-religious books per year and its entire annual scientific research budget is about $54.8 billion so they could quadruple the science while triple the reading

God is worth a Toyota Corolla to the typical believer but God said at least a 5 Series BMW would be more appropriate.

The fact that certain sections of society are accepting the opportunity cost means that religion has some positive value to them (like smoking has for smokers) and I think my estimate of its net present value in the current market is accurate. Initially I thought my estimate is merely a minimum (the least they would be willing to pay) but now I also think it is a maximum. They are supposed to pay 10% of their income (God’s asking price according to the bible) but no group even approaches that (the mean is around 2.5-2.7%) and are constantly being begged and manipulated for funds.

I divided the number of church attendances per year (16.2) by the number of weeks per year (52) and multiplied that by the number of all members (145838334) to get an estimate of the number of full time donors. I divided the result into the $42.11 billion donated to get a figure of $926.8 contributed per regular church member per annum. At a life expectancy of 78 years this means the expected lifetime contribution as an adult between 18 and 78 is God is worth $55608 to someone religious enough to attend church regularly. (I get similar values – in dollars - for the UK and South African churches). But since 1/4 of the people make 3/4 of the donations for the 3/4 least generous or wealthy of the religious their religion is currently worth $18536 - or roughly a new Toyota Corolla. For the 1/4 most zealous (and wealthy) religious the value of their religion would be $166824. That's somewhere between a Porsche 911 and a Ferrari F430. The 10% tithing requirement suggest that the poorest 3/4 are supposed to value religion at least as much as a 5 series BMW per person or a whole house for a family of 3.

The church of God is perhaps worth as much as $17.38 trillion to the current cohort of all believers over their lifetime.

The absolute value of religion is still increasing but the relative value is declining.

Is the value of religion falling or rising? Well for the US the total and per capita (of believers only) contribution is increasing in real absolute terms, and total church membership is up, so demand relative to supply must be increasing. The car equivalent is more than triple today what it was in 1968. On the other hand that has more to do with the falling relative value of cars than an increase in the value placed on religion. The religious are tending to give a smaller proportion of their income than they used to - its dropped from 3.1% in 1968 to 2.5% in 1998 (and up to 2.7% in 2005 in wake of 9-11 inspired revivals), and a steadily smaller proportion of the population are religious enough to practice and pay for it. Apparently Catholics allocate about only 1/3-1/2 as much of their income to religion as Protestants. What's happening is that believers are willing to exchange more products for their religion than they used to but it’s nevertheless a smaller sacrifice. That arguably implies that religion is worth less today than it was a generation ago. Nonetheless at $289.656 billion a year over 60 years of adult life the value of religion to the current cohort of believers is around $17.38 trillion. That’s serious money.

In the UK (and elsewhere in Europe outside of ex-communist countries) even the absolute contributions and church attendances have fallen dramatically. In ex-Communist states religion is on the rise but is still lower than the rest of Europe. This rise will probably reverse sometime.

In the Muslim world people are becoming more fanatical (and no doubt increasing financial contributions) but one needs to be careful here because religion is a vehicle for political expression in Muslim states (rather than solely a devotion to God) and there is a decline of interest among the youth throughout the Muslim world - even in Iran and Saudi Arabia. Even here the value of religion is declining. It would be interesting to put a cash value to the various religions for the faithful and compare them all.

So there you have it – the typical believer gives up a Toyota Corolla, and a family of 3 gives up a house, to practice their faith. Is that more or less than the ancient Hebrew sacrificed in livestock at the altar over his lifetime? Unfortunately I don’t really know but it can’t be far off. Collectively the US faithful give half as much to charity as the US devotes to porn. That should give you some idea of the values of religion today.

Sunday, July 10, 2011

Cost of Communism

Coincidentally I have been stimulated to think about communism over the last few days. Firstly I was reading something about the origins of the term Molotov cocktail which detailed some of the horrors committed by Molotov e.g. the bombing of Finland following the Molotov-Ribbentrop Pact where he claimed they were dropping food parcels on the starving Fins, the murder of the Polish officers, various Russians etc. Then a few days later someone remarked that one wouldn’t dare hang a portrait of Hitler on your office wall but having a bust of Lenin on your desk seems to pass without comment. This is especially strange if you recall that Nazism was a form of socialism – the word Nazi means ‘national socialism’

I knew that both Stalin and Mao were responsible for many more deaths than Hitler i.e. 15-20 million and 20-65 million versus 6 million. This doesn’t count the deaths caused by Lenin and communists after Stalin and Mao. I wondered what that was as a percentage of their populations. It turns out the Nazis exterminated 7.44% of their population and Stalin 8.9% and Mao 7% (best estimate). The Khmer Rouge managed to cause the deaths of 12.5% of their population. To put that into perspective Russia lost 15% (and the UK 13.3%) of its mobilized soldiers during WW I, so living under communism is somewhere between 50-80% as dangerous as being on one of the most deadly battlefields in history.

So much for the actual outcomes of Communism versus Nazism, but what about differences in justification? Mass murder was routine. Stalin was known to mutter “Who will remember or care about these people in a few years?” as he signed execution orders for lists containing thousands. Bertrand Russell remarked that Lenin had laughed when he confronted him on the ethics of large scale state killings. He regarded terror as an essential aspect of maintaining Communism in the face of its unpopularity and not as an aberration of Marxism at all. Apart from mass executions starvation was the main tool, and they went to great lengths to justify it. Consider this quote from Timothy Snyder’s book Bloodlands: Europe between Hitler and Stalin.

As Stalin interpreted the disaster of collectivization in the last weeks of 1932, he achieved a new height of ideological daring. The famine in Ukraine, whose existence he had admitted earlier, when it was far less severe, was now a "fairy tale," a slanderous rumor spread by enemies. Stalin had developed an interesting new theory: that resistance to socialism increases as its successes mount, because its foes resist with greater desperation as they contemplate their final defeat...

[...]

Stalin never personally witnessed the starvations that he so interpreted, but comrades in Soviet Ukraine did... Forced to interpret distended bellies as political opposition, they produced the utterly tortured conclusion that the saboteurs hated socialism so much that they intentionally let their families die... Even the starving themselves were sometimes presented as enemy propagandists with a conscious plan to undermine socialism. Young Ukrainian communists in the cities were taught that the starving were enemies of the people "who risked their lives to spoil our optimism."

Similar things happened in China. Ethically, how far away from Hitler’s justification of The Final Solution is that?

Communists were every bit as murderous as the Nazis and their justifications were just as revolting. Let’s look at other aspects of welfare. How about freedom? Both the Nazis and communist regimes condemned large numbers of people to slavery – only as a means of production they were now not privately owned. I suppose that made it OK then.

There was a complete lack of freedom of thought or conscience in both the Nazi and communist states. Compare the disowning of Jewish science by the Nazis with the suppression of bourgeois science (especially genetics) by the Soviets and the killing of educated people (or even just those wearing glasses) because they were bourgeois by the Chinese and Cambodian communists. The Nazis burnt books and the communists would punish those who owned western books. Religion, which is intimately related to morality, was suppressed or controlled by both Nazis and communists.

How about eking out a living? If we define communism as collective (or state) ownership of the means of production - so as to distinguish it from various varieties of socialism or welfare state where the means of production are still private - maybe communism is as productive as capitalism. Um no! Everywhere in the world where communism was tried the economies have been sluggish at best or simply contracted. Many have experienced periodic famines where other countries didn’t – even in Africa and Asia. One could blame that on accidents of climate or culture or IQ differences. However two interesting natural experiments control for just about everything that could be confounding variables – IQ differences, cultural differences, climate, conscientiousness etc. These were East and West Germany and North and South Korea. I looked up the real GDP per capita of these countries throughout their different paths.

East and West Germany started with a GDP per capita of $14987 (2009 dollars) in 1949 and ended up with $34116 and $19685 in 1990 for West and East Germany respectively. East Germany only managed to increase its productive capacity by 31% in 41 years while West Germany added 128% - 4.07 times as much. Over the full 41 year communist period East Germany produced 41.2% of the income per capita that West Germany did. The difference amounted to $370210.6 per person. In Germany that is the equivalent of 2.11 new houses per person.


North and South Korea adopted more hardcore communist and capitalist systems than East and West Germany respectively, so the difference is even more dramatic. In 1972 the two Korea’s had the same GDP per capita of $5818 (in 2009 dollars), but a mere 7 years later North Korea had dropped to $2645 - a contraction rate of 10.6% per year. North Korea’s economy has continued to contract ever since -at a rate of 1.28% per year - to only $1800 today. Communism has destroyed 69% of North Koreas productive capacity so far. They are less than 1/3 as well of as they would have been with no changes at all. Meanwhile capitalism increased South Korea’s productive capacity more than 5 fold over the same period. As a result North Korea is only 6% as productive as South Korea today. It has produced 18% as much as South Korea over 37 years. That amounts to a difference of $436656.2 per person – enough for every family of 5 to buy a 3 room house in Seoul’s super high price housing market.


While the rest of the world industrialized on the back of increased agricultural productivity which freed farming labor for industry the communist world often tried to industrialize while their collective farms reduced in productivity. They also did silly things like tear up existing railways. Often they adopted a sort of cargo cult mentality where for example they noticed that developed nations had steel so they embarked on large scale steel production, often melting down perfectly usable implements to do so, whether or not it was needed. Some economists have argued that it is impossible to allocate resources efficiently by central planning rather than unregulated prices. No central planner could possibly take into account all local conditions or opportunities and the diversity of values and needs, no matter how smart or how many super computers it has. Uncontrolled prices on the other hand balance all these things automatically and very quickly. The result was that a great deal of communist production was of stuff that nobody really wanted and there was a huge amount of waste. It’s unsurprising that communism turns out to be so relatively unproductive.

Communists were as murderous, as anti-freedom and as bad for material welfare as the Nazis ever were. Why then are communism and communists not as vilified as the Nazis and Hitler? Oddly enough those who think income and wealth ought to be redistributed by government are no more pro communist than those who are opposed to redistribution. Neither are lower classes more so than upper classes. If we were rational we would react with the same degree of disapproval or outrage at a Lenin bust or Maoist tattoo as we would to a swastika or Hitler portrait, and to a communist apologist as we would to a holocaust denier – there is plenty of obvious evidence to back us up.